1. Name of the location of 90% of epistaxis
2. A genetic disorder that forms AV malformations in the skin, lungs, brain etc
3. Name of posterior vascular plexus in the nasal cavity causing posterior epistaxis
4. 1st line treatment for all epistaxis
5. The common brand name for anterior nasal packing
6. Chemical used in cautery sticks
7. Physically scaring complication of posterior nasal packing with foleys catheter
Coming soon..

Audiograms
Introduction
This page describes the basics of audiometry (testing hearing with a pure tone audiogram). On the Swansea ENT course you need to be able to do the following:
-
Diagnose normal hearing from an audiogram
-
Diagnose conductive and sensorineural hearing loss on audiograms
-
Diagnose common causes of hearing loss from audiograms
This page will begin with an overview of the process of audiometry before describing the appearance of normal hearing on an audiogram. Further on you will find common patterns of hearing loss together with a short commentary.
This is a high-level review and does not consider the standards that must be met for audiometry, the equipment used, or details of such processes as masking during hearing testing. If the reader wishes to know more about these, please consult The British Society of Audiology for documents on recommended procedure.
What is an audiogram?
An audiogram is a graphical representation of a person's ability to hear at different standardised frequencies. Basically, it's someone's hearing ability in picture form.
It builds on what you may have found performing the bedside Rinne’s and Weber’s tests. If you need to recap these, you can do so here.
How is it done?
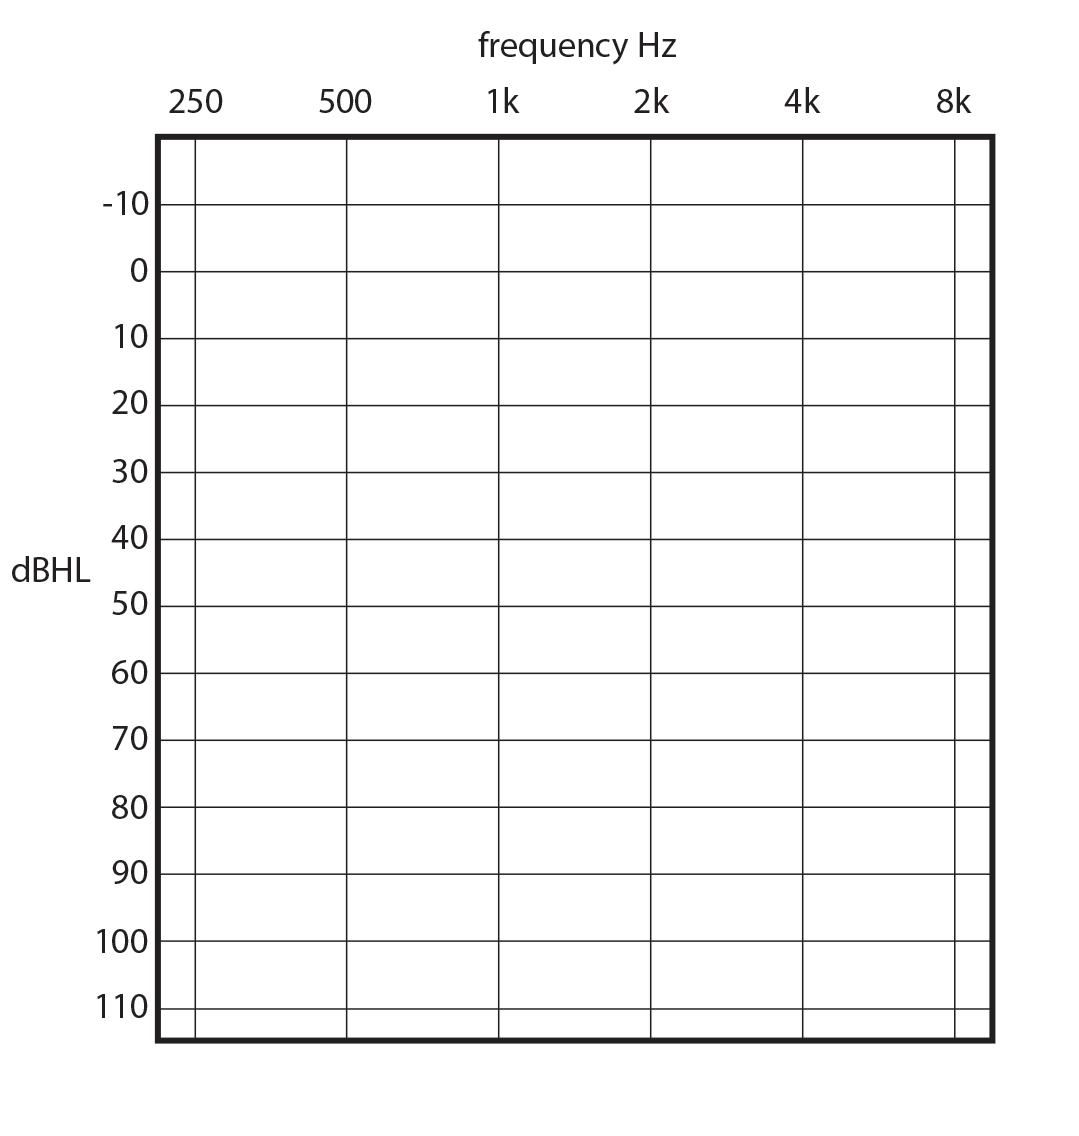

This is a blank audiogram. Frequency is along the x-axis in Hertz and intensity is along the y-axis in decibels Hearing Level. Normal hearing for an adult is between 0 and 20dBHL across all frequencies. A key to the symbols used is provided on the right of the graph. The symbols are those approved by the British Society of Audiology and are the ones used in Swansea.
You will not be expected to create an audiogram yourself as part of the course at Swansea, however, in order to interpret them properly, you should understand how they’re performed.
Procedure
1. Firstly the ears are cleaned of wax and discharge. Each ear will be tested separately.
2. The patient is then placed in a sound-proof room and pure tones, over a range of frequencies, are delivered to the patient through headphones at varying intervals and intensities.
3. The patient presses a button when they can hear a noise. The first noise played should be one that the patient can hear, so the patient knows what the sound is and which ear is being tested. This is usually at a frequency of 1000 Hz. Once the patient presses the button, the noise is reduced in intensity by 10dbHL until the patient can no longer hear it. Marks are made at the point where the patient can hear the sound 50% of the time as shown in the left-most image below. This is repeated at 2K and each frequency thereafter on the x-axis. The process is repeated with the other ear until a complete air-conduction audiogram is drawn (right-most image below).


4. The process is performed again, but a bone oscillator is placed over the mastoid process which vibrates at different frequencies. This vibration will travel directly to the cochlea and stimulate it. This means that we can test the function of the cochlea separately. When air-conduction thresholds are normal this bone-conduction line is usually omitted from the audiogram.
Conductive and Sensorineural Hearing Loss
It is important to understand how to diagnose conductive and sensorineural hearing loss from an audiogram. Below we show the common patterns that arise in clinical and OSCE examinations.


Unilateral conductive hearing loss.
Bone conduction is normal on the left (blue brackets) but air conduction is poor.
Possible causes: otitis media, perforation, cholesteatoma or a rare middle ear tumour.
Unilateral sensorineural hearing loss.
This time, bone conduction is also abnormal, demonstrating that there must be a problem with the cochlea or cochlear nerve
Possible causes: idiopathic, acoustic neuroma, viral, cochlear bleed.
It is imperative to perform an MRI internal auditory meatus at this point to exclude acoustic neuroma.
Bilateral, high frequency, sensorineural hearing loss,
Possible cause: presbyacusis, the hearing loss associated with old age.
A particular issue for those suffering from presbyacusis is listening to speech. High frequency sounds such as 'f', 's', 'ch', and 'sh' and many consonants will become difficult to hear.
Note, no bone conduction marks are shown. If they were, they would overlap with the Os and Xs, making a messy graph.
Bilateral sensorineural hearing loss at 4kHz.
This is noise induced hearing loss. People who are consistently exposed to loud noises, such as construction workers, musicians or military personnel, may present with bilateral sensorineural hearing loss.
Whether the damage is acute or chronic, the loud sound overstimulates the fragile hair cells, leading to their permanent injury or death.
Noise induced hearing loss has a typical, ‘tick’ appearance on the audiogram, around the 4K mark.
Low frequency unilateral sensorineural hearing loss
This is typical of Ménière’s disease. The hearing loss fluctuates, which is highly unusual, however, it will become permanent and progress with time and cannot be prevented, even with treatment.
If you see an asymmetric sensory loss like this, you must first rule out an acoustic neuroma and organise an MRI scan.
Bilateral sensorineural hearing loss.
Although rare in the UK, a possible differential is ototoxicity. It can be caused by a number of drugs, such as aminoglycosides (like gentamicin), loop diuretics or platin containing chemotherapeutics.
Other differential diagnoses could be trauma or bilateral acoustic neuromas, if the patient suffers from neurofibromatosis-2, for example.
Unilateral dead ear.
Although there appears to be a response to an 80dB noise at 250Hz, do not be fooled into thinking the ear is working. This is the vibrotactile response, the patient is feeling the sound rather than hearing it.
Common causes of a dead ear would be labyrinthitis, accidental trauma to the temporal bone and post-surgical, if they’ve previously had an acoustic neuroma removed for example.
If you see an audiogram like this without good explanation you must rule out an acoustic neuroma and organise an MRI scan.
Bilateral conductive hearing loss.
The commonest cause of this appearance is glue ear. Bilateral perforations would also be a possibility, as would otosclerosis.
Otosclerosis is a condition that lays down spongy bone around the stapes footplate. It is commoner in young women and has genetic, hormonal and viral origins.
Mixed hearing loss
In this example there is a defect in the left ear.
Air conduction is significantly below normal and so is bone conduction.
However, there is a large gap between the air and bone lines, meaning that there is both a sensorineural and conductive loss. This is known as mixed hearing loss.
Possible causes: cholesteatoma, if it invades both the middle and inner ear, trauma, or two separate diseases one of the cochlea and one of the middle or outer ear.
Conclusion.
This concludes this short introduction to audiometry. It is a gold-standard process that provides far more information than tuning forks alone. However, the humble tuning fork still has relevance, as audiometry is not immediately available in may clinical practices.
Remember that we wont be judging you on the details of the performance of tests but an understanding of the patterns that we see will greatly enhance your diagnostic skills.
We are indebted to Dr. Alex Teasdale for his work on creating and teaching the content of this page in 2020.